Qiushi PapersTested on History
Can Individual Investors Earn Excess Returns from Public Data? A Research Report on 116 Pre-Registered Tests
LuluH. (2026). Can Individual Investors Earn Excess Returns from Public Data? A Research Report on 116 Pre-Registered Tests [Research report]. Qiushi Papers. https://qiushi.luluh.top/en/116-rounds-report/
LuluH. 2026. “Can Individual Investors Earn Excess Returns from Public Data? A Research Report on 116 Pre-Registered Tests.” Research report, Qiushi Papers, October 12, 2026. https://qiushi.luluh.top/en/116-rounds-report/.
@article{luluh2026116en,
  author       = {LuluH},
  title        = {Can Individual Investors Earn Excess Returns from Public Data? A Research Report on 116 Pre-Registered Tests},
  journal      = {Qiushi Papers},
  year         = {2026},
  month        = {10},
  note         = {Research report, not peer reviewed},
  url          = {https://qiushi.luluh.top/en/116-rounds-report/},
  urldate      = {2026-11-21},
  language     = {english},
}
Export to a reference manager: RIS (EndNote, Zotero, Mendeley) · BibTeX
Cite as: LuluH. (2026). Can Individual Investors Earn Excess Returns from Public Data? A Research Report on 116 Pre-Registered Tests [Research report]. Qiushi Papers. https://qiushi.luluh.top/en/116-rounds-report/
This is the English edition of the research report dated October 12, 2026, translated from the Chinese original (中文版, Chinese PDF). If the two differ, the Chinese version prevails.
The one-page conclusion: the final choice
The final choice after 116 rounds of research is the simplest setup: in US dollars, hold an all-world stock ETF forever; in renminbi, buy a few low-fee CSI 1000 (中证 1000) enhanced index funds; invest new money as soon as you have it; no market timing. None of the other approaches studied did better once costs and taxes were deducted.
| Money | Final choice | Why (relevant rounds) | What to expect |
|---|---|---|---|
| US dollars | Hold an Ireland-domiciled, accumulating all-world stock ETF (VWRA or FWRA) forever, with no market timing and no rebalancing | Betting on a single country and holding for 30 years has a 12.4% probability of losing money after inflation, versus 0% for a global portfolio (round 101); if you never sell there is no taxable income, and no US estate tax (美国遗产税) is due (round 100); the moving-average timing rule does the same as buy and hold after tax (round 54) | Returns equal the global stock market; a crisis like 2008 would cut it in half, and it could take as long as 11 years to get back to where you started |
| Renminbi (Alipay / Tiantian Fund (天天基金)) | 3–5 low-fee CSI 1000 enhanced index funds (指数增强基金, “指增”), Class A shares, plain regular investing (普通定投); spread across different fund companies; optionally put about 1/4 in a government bond ETF or Yu’e Bao (余额宝) to lose less, and rebalance to the target weights at the end of each year | Even after removing IPO subscription (打新) income, they still beat the index by 3–7 percentage points a year in 2023–2025 (rounds 21, 53); lower-fee funds do better (round 57); 3–5 funds are enough to diversify (round 47), and products from the same company rise and fall together (round 112); rebalancing once a year is enough (round 109); with 1/4 in government bonds, drawdown is −27% vs −36% (round 75) | About 3–5 percentage points a year above the CSI 1000; crowding by private funds (私募) may squeeze this out, so give it a checkup every October (round 102) |
| Binance (币安) (optional) | BTC cash-and-carry (basis) arbitrage (long spot + short perpetual) | 2020–2026 annualized 9.8% vs 3.1% for short-term bonds (round 22) | Over the last 12 months, roughly equal to short-term bonds; exchange risk cannot be measured |
| New money | Buy a fixed amount as soon as you have it | Waiting for a 20% drop before buying leaves you about 3% worse off on average (round 104); in a fair comparison, “smart” regular investing (智能定投) adds only 0.4% (round 105) | — |
| Don’t | Stock picking, limit-up chasing (打板), chasing newly listed coins, valuation-based timing, large/small-cap rotation (二八轮动), grid trading, switching funds based on last year’s performance, holding with leverage for the long term, adding a small-cap value tilt | After costs, all do worse than buying the index, or stopped working after they became popular (Sections 4, 6, 7) | — |
The three most important findings:
- Only one source of excess return can be reliably captured: CSI 1000 enhanced index funds (about 3–5 percentage points a year). The other 100-plus approaches either earn less after costs or stopped working once they became public and popular.
- Tax changes the answer: the moving-average timing rule reduces drawdowns in 10 markets, but for a Chinese resident who holds forever and files taxes as required, the 20% tax due on sales wipes out its return advantage, so buy and hold is the choice.
- Betting on a single country (including the US) carries real risk: across 16 developed countries over 150 years, the probability of losing money after inflation over a 30-year holding period is one in eight; a globally diversified portfolio never lost, and it did not earn less.
Abstract
This paper uses free public data to run 116 rounds of tests of whether an individual investor with very little capital who is a Chinese tax resident (中国税收居民) can reliably earn excess returns (September 28 to October 12, 2026; the data for round 113 could not be obtained). In every round, the hypothesis, the pass/fail criteria and a prior probability were registered in the research log before the data were examined; all results are net of trading costs, and those involving overseas assets are further calculated under Chinese individual income tax. There are five main findings.
First, US market timing: a “three-moving-average voting” rule chosen on 1927–1989 data returned 11.77% annualized out of sample in 1990–2026, versus 11.01% for the S&P 500, with maximum drawdowns of −37% vs −55%; applied unchanged to 4 developed-market regions outside the US and to 4 emerging markets, the rule held up. But its return advantage ranges from 0 to +1.1 percentage points depending on the rebalancing day, it has lagged by about 0.8 a year since 2009, and it is not significant after accounting for selection luck (Deflated Sharpe 0.01). It is “insurance against long bear markets,” not a reliable source of excess return.
Second, stock selection and anomalies: most of the 212 published US anomalies decayed after publication and are concentrated in small caps; the predictive power of A-share price-volume signals and of a self-built machine-learning model (monthly rank IC 0.11) is concentrated on the loser side, and long-only versions do not earn significant excess returns. Among company-announcement signals, buying after a large positive earnings pre-announcement (业绩预告) yields an excess return of +1.50% over 60 trading days (t = 2.82), but this has been negative in 2022–2025.
Third, Chinese mutual-fund (公募) enhanced index funds: in 2023–2025, CSI 1000 enhanced funds beat index ETFs by 4–8 percentage points a year after fees. After removing IPO income using about 100,000 offline IPO allocation (网下打新) records, the excess returns of CSI 300 and CSI 500 enhanced funds largely disappear, while CSI 1000 enhanced funds still have about 3.2% (t = 2.7) after controlling for size, turnover and low beta.
Fourth, tax and investment horizon change the optimal choice: when holding forever and filing as required, the timing rule’s after-tax return is the same as buy and hold (+0.03 percentage points a year); data for 16 developed countries in 1870–2020 show that betting on a single country and holding for 30 years has a 12.4% probability of a real loss, versus 0 for a global portfolio.
Fifth, the credibility of the research itself: 67 prior-probability forecasts averaged 38%, while 31% actually occurred; the Brier score was 0.145 (baseline 0.215), with systematic over-optimism that “my own idea will pass.”
The conclusion: for a small Chinese individual investor, very little excess return can be reliably captured from public data; the most valuable findings are what not to do, and the allocation choices that follow from tax, horizon and diversification across countries.
Abstract (English). Using only free public data, I ran more than 110 pre-registered tests (28 Sep – 12 Oct 2026) of whether a small Chinese retail investor can earn reliable excess returns after costs and Chinese personal income tax. Each test recorded its hypothesis, pass/fail rule and a prior probability before the data were examined. A three-moving-average timing rule chosen on 1927–1989 US data cut drawdowns out of sample (−37% vs −55% for 1990–2026) and replicated in eight other markets, but its return edge is small, not significant after selection (Deflated Sharpe 0.01), and disappears after tax for a buy-and-never-sell investor. Published anomalies, A-share price signals and machine-learning forecasts were concentrated on the short side. The one robust long-only source was CSI 1000 enhanced index funds: after removing IPO-allocation income, size and turnover factors and low beta, their alpha is about 3.2% a year (t = 2.7), while CSI 300/500 enhanced funds’ excess returns were largely IPO income. JST data for 16 countries (1870–2020) show a 12.4% chance of a negative real 30-year return for a single country versus none for a global portfolio. The result is a simpler plan than the one the project started with: a global accumulating ETF held forever, plus a few low-fee CSI 1000 enhanced funds.
1 Introduction
The question this study tries to answer is: can a Chinese individual investor who uses only public data and has very little capital (a few thousand US dollars at most) reliably earn more, after costs and taxes, than “what they would have done anyway” (buying an index, parking money in a money market fund)? Small capital means that minimum commissions, whole-share lots and subscription minimums all eat into thin edges; tax-resident status means that gains from overseas sales and dividends must be reported at 20%; the available channels are US brokers, A-shares and over-the-counter funds (场外基金), and cryptocurrency exchanges; convertible bonds, Southbound Stock Connect (港股通), exchange-traded options and the like have minimum-asset requirements, so a small account cannot open them.
The literature offers three pieces of background for this question. First, many published return anomalies decay after publication (McLean and Pontiff 2016) and are concentrated in small caps, where trading costs are high (Hou, Xue and Zhang 2020). Second, the more rules a backtest tries, the less credible the statistical significance of the best result (Harvey, Liu and Zhu 2016; Bailey and López de Prado 2014). Third, individual investors’ actual returns are often eaten up by trading, attention-driven buying and taxes (Barber and Odean 2000, 2008). This study treats these three points as methodological constraints rather than conclusions.
This paper makes three contributions.
- Within a single pre-registered framework, it compares US stocks, A-shares, mutual funds, cryptocurrencies, arbitrage and allocation questions on the same basis, and honestly reports all 116 rounds (most of which did not pass).
- It rebuilds, with free data, several analyses that usually require commercial databases: reconstructing the IPO income of mutual-fund enhanced index funds from offline allocation details, recovering liquidated funds, and measuring crowding among quantitative private funds (量化私募); and reconstructing point-in-time financial statements from SEC XBRL.
- It brings Chinese individual income tax, a perpetual holding horizon and US estate tax into the strategy comparison, showing that the same rule can lead to opposite conclusions for different investors.
Section 2 describes the research design and data; Sections 3–7 report results by topic (US market timing, stock selection and anomalies, enhanced index funds, other assets, investor-level questions); Section 8 discusses credibility and limitations; Section 9 concludes. The appendix lists all 116 rounds.
2 Research design and data
All 116 rounds followed the same process, with each step recorded in the research log in time order; the pass/fail criteria were written down before the results were seen and were not changed after the results came out.
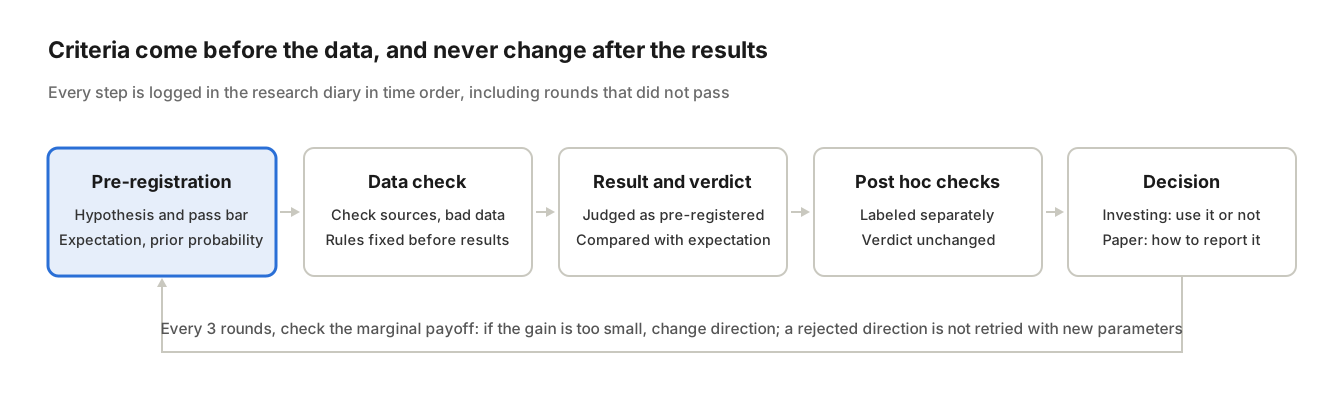
The research process for each round · 5 steps, with a marginal-payoff check every 3 rounds
2.1 Pre-registration
Each round’s registration includes: why it is being done; what has already been seen (a contamination statement); sample, definitions and costs; pass/fail criteria; items that are only described and do not count toward the verdict; and the expected result and prior probability. A data check is done before the results are viewed, and changes to definitions can be made only at this step. Checks thought of only after seeing the results are labeled separately as “post hoc” and serve only as a reference; for example, after round 98 found that the earnings pre-announcement table excluded delisted companies, it recalculated using “stocks that survived to today” as the benchmark, but did not change the original verdict.
2.2 Out of sample and multiple testing
- Splits: the US market-timing rule was chosen on 1927–1989 and tested on 1990–2026; the A-share machine-learning model was explored on 2006–2016 and, once finalized, tested only once on the hold-out period from 2016-10 onward.
- Corrections: multiple tests within one round use the Holm correction; rules picked from many candidates use the Deflated Sharpe Ratio; stock-selection rules use a permutation test (randomly picking stocks from the same candidate pool, repeated one hundred times).
- Discipline: directions already rejected are not retried with different parameters; a marginal-payoff check is written every 3 rounds, and if the gain is too small, the research switches to a different broad direction.
2.3 Costs and taxes
All results are net of trading costs. A-share event studies assume a round-trip cost of 0.25% (commission of 0.05% (万五), stamp duty on sales, market impact), and note the effect of the 5-yuan minimum per trade on small accounts; funds use after-fee net asset values. Overseas assets follow the Chinese individual income tax treatment: 20% on dividends and on gains from sales (the 10% US withholding under the China–US tax treaty is creditable), with gains and losses offset within the same tax year and no carryforward across years; the main specification assumes filing as required.
2.4 Data
| Data | Where used | Biases and handling |
|---|---|---|
| Ken French Data Library (US daily from 1926, international from 1990) | Market timing, factors, regular investing | Modeled ETFs; checked against real ETFs from 2007 |
| Chen–Zimmermann open-source anomaly data (212 anomalies) | Decay before vs after publication | Portfolios rebalanced once a year used only for accounting signals |
| SEC XBRL point-in-time financial statements | S&P 500 profitability factor | Reconstructed by filing date; stock splits and share-unit errors handled |
| JST Macrohistory Database (16 countries, 1870–2020) | Single-country risk | Only countries that are rich today; Germany 1922–1924 excluded |
| Tiantian Fund, East Money (东方财富) Data Center | Enhanced index funds, offline IPO allocation, earnings pre-announcements, shareholder counts | Some tables exclude delisted companies → survivor benchmark; liquidated funds recovered via allocation-account codes (配售对象编码) |
| Tencent unadjusted daily prices + baostock adjustment factors | A-share price-volume and event studies | Tencent’s adjusted prices use additive adjustment, so returns are wrong; switched to proportional adjustment |
| China Securities Index (中证指数) website, China Financial Futures Exchange (中金所) | Index backtests, futures discount | Pre-launch backfilled data have selection bias, tested separately |
| Yahoo Finance, Binance, FRED | Real ETFs, cryptocurrencies, exchange rates and interest rates | Binance data include delisted coins; noise from differing London closing times noted separately |
3 US market timing: the moving-average voting rule
Only one US market-timing rule survived, and its reliable value is reducing drawdowns, not earning more: out of sample in 1990–2026 it returned 11.77% annualized vs 11.01% for the S&P 500, with maximum drawdowns of −37% vs −55%.
3.1 The rule and the out-of-sample test
The rule (called v3) looks only at how many of the 150-, 200- and 250-day moving averages the S&P 500’s closing price is above: 0, 1, 2 or 3 correspond to 0.5, 0.75, 1 or 1.25 times equity exposure, implemented with 1x and 2x ETFs plus Treasuries; it is checked once at each month-end, and trades only when the deviation from target exceeds a tolerance. The rule was selected from about 330 candidate combinations on Ken French daily data for 1927–1989; data after 1990 had not been looked at before it was chosen.
The best in-sample candidates were of the “volatility targeting” type (adjusting exposure to recent volatility), and they all failed out of sample; pure trend (selling everything below the 200-day line) earned less than holding out of sample. Neither type was retried afterward.
3.2 Replication in other markets
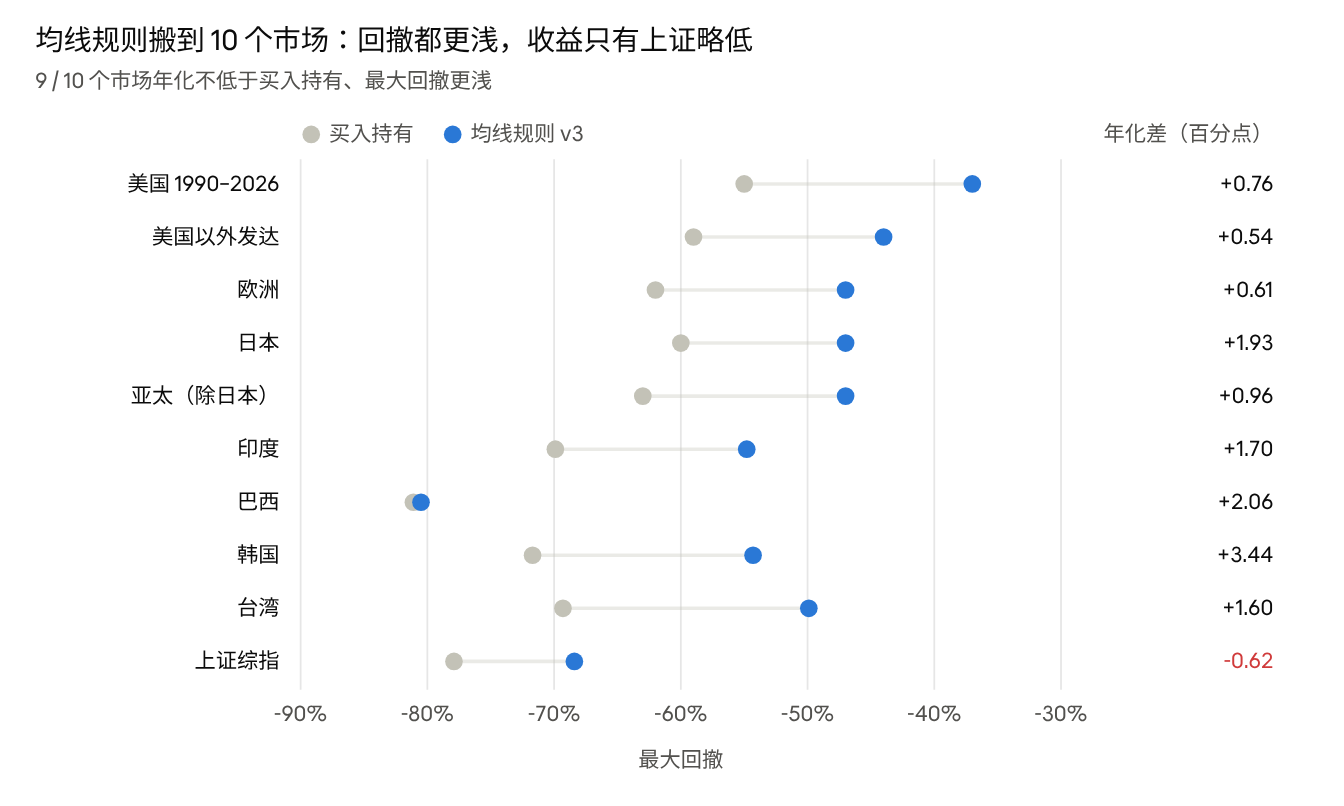
Reported in rounds 3, 12, 14, 83 · US 1990–2026 out of sample; other developed regions 1991–2026; India, Brazil, South Korea, Taiwan 1996/1998–2026 (in US dollars); Shanghai Composite 1992–2026
Chart text (translated): Moving-average rule applied to 10 markets: drawdowns are shallower everywhere, and only Shanghai has slightly lower returns. 9 / 10 markets have annualized returns no lower than buy and hold and shallower maximum drawdowns. Axis: maximum drawdown, −90% to −30%. Series/labels: gray dot = buy and hold, blue dot = moving-average rule v3; right column “Annualized difference (percentage points)”: US 1990–2026 +0.76; Developed ex-US +0.54; Europe +0.61; Japan +1.93; Asia Pacific (ex-Japan) +0.96; India +1.70; Brazil +2.06; South Korea +3.44; Taiwan +1.60; Shanghai Composite −0.62 (in red).
Applied without changing a single word to the 4 developed-market regions in French’s international data (round 14) and to India, Brazil, South Korea and Taiwan (round 83, in US dollars), the rule gave “annualized return no lower, drawdown shallower” in all 9 markets. The Shanghai Composite is the exception: its drawdown is 9.5 percentage points shallower, but its annualized return is 0.62 lower (round 12). In every market, the rule earned more before 2009 and lost slightly after; the return advantage came from long, slow bear markets like 2000–2002 and 2008.
3.3 Robustness
- Rebalancing-date luck (round 15): moving the month-end check to any of the other 20 trading days in the month, the out-of-sample return advantage ranges from 0 to +1.1 percentage points, with a median of about +0.5.
- Selection luck (round 20): the Deflated Sharpe Ratio computed over 330 candidates is 0.01, and the out-of-sample Probabilistic Sharpe Ratio is 0.75—the excess return is not significant.
- Attribution: in CAPM, three-factor and Treynor–Mazuy regressions, α is significant in the full sample but not out of sample; timing ability shows up only at the annual scale.
- Defensive position in intermediate-term Treasuries (rounds 18, 19; called v3.1): better than short-term bonds in all three periods; out-of-sample annualized return 12.51% vs 11.77% for the short-term-bond version (S&P 500 11.01%); compared with a fixed stock-bond portfolio of equal volatility, 12.5% / −32% vs 10.8% / −52%. The cost is larger losses when stocks and bonds fall together, as in the 1970s and 2022.
- Renminbi basis (round 17): the drawdown advantage remains, at about 17 percentage points; the exchange rate is normally a cushion (monthly correlation −0.25), but in 2008 it amplified losses.
3.4 Chinese individual income tax and holding forever
Chinese tax residents report gains from overseas sales and dividends at 20%, with gains and losses offset within the same tax year and no carryforward across years (round 54). v3 sells every time it steps down a level, realizing gains equal to about 6–8% of net asset value each year; buy and hold can defer indefinitely.
| v3 − S&P 500 (out of sample, annualized pp) | v3 (short-term bonds) | v3.1 (intermediate-term Treasuries) |
|---|---|---|
| Pre-tax | +0.83 | +1.57 |
| After tax, sell everything at the end | −0.22 | +0.40 |
| After tax, never sell | −0.59 | +0.03 |
| After tax, from 2009-03 onward | −2.44 | −2.48 |
The pre-tax difference in the table uses the round 54 basis (starting 1990-01, with the first month in short-term bonds), so it differs slightly from the +0.76 in Section 3.1.
The after-tax maximum drawdown is still −35% vs −55%. A “sell-less version” (trading only when off by more than one level, and stepping down at most once a year) is only 0.10 lower after tax, but it could not step down in 2008 and its drawdown was 8.3 percentage points deeper, so it failed (round 64). Conclusion: for an investor who holds forever and files as required, v3.1’s return is the same as buy and hold, and only the drawdown advantage remains.
4 Stock selection and anomalies
None of the public stock-selection signals lets a small long-only investor reliably make money after costs: anomalies among US large caps have essentially disappeared after publication, the predictive power of A-share signals is concentrated on the “stocks to avoid” side, and earnings pre-announcement drift, the only signal that worked on the long side, has also vanished since 2022.
4.1 Multi-factor stock screener
The screener scores US stocks on momentum, valuation and growth, and holds a single stock at full position each time. Its backtested annualized return is about 17%, slightly above the S&P 500, but its maximum drawdown is −55% vs −34%; in the permutation test it beat only 86% of random stock picks (threshold 95%), and its CAPM α is not significant. Its fundamental components add nothing either: the “both revenue and net profit growing” filter has t = −0.42 in S&P 500 point-in-time data (round 30), and the valuation score’s rank IC is 0.003 (round 31).
4.2 Published US anomalies
- 18 price-based factors in the S&P 500 are all insignificant after Holm correction (round 1); in French’s all-market data, price-based anomalies among large caps have essentially disappeared since 2000 (round 2).
- Of the 212 anomalies published by Chen–Zimmermann, 28% are still significant after publication under the original papers’ methods, which include micro-caps; in the large-cap half only 4% remain, and after multiple-testing correction not one is left (round 3)—anomalies live mainly in small caps, where trading costs are high.
- The only one that holds up across data sources is profitability: using SEC XBRL point-in-time statements it passed pre-registration in the S&P 500 (round 4), but the long-only version has t = 1.64 (round 6), and outside the US t = 0.42 (round 10).
- Insider buying has t = 0.41 (round 8); self-mined price-volume factors in the S&P 500 already failed in the exploration period (round 16); industry momentum has t = 1.76 after publication, which under the rules is a fail, with no parameter tweaking to make it pass (round 40).
4.3 A-share price-volume signals and machine learning
- Abnormal turnover and short-term reversal effects are strong (t > 7), but the premium is concentrated on the short side (round 11).
- 53 daily features + ridge regression: explored on 2006–2016 and, once finalized, tested only once on the hold-out period from 2016-10 onward. The monthly rank IC is 0.108 (t = 10.3), but going long only the top 10% earns +4.3% a year after costs, with t = 1.72, below the threshold of 2, so it fails (round 13). The same model’s “most likely to fall” list underperformed the whole market in 78% of months during the hold-out period, by −1.90% a month on average (t = −7.4); it has been switched to monthly forward tracking (round 94).
- The short-term trades common among retail investors all lose money: holding recent IPOs (次新股) for 3 years after their shares first stop hitting the daily limit (开板) returns −9.6% a year relative to stocks of the same market cap (t = −3.3, round 93); buying at the open the day after a limit-up returns −0.91% per trade (t = −27, round 95); bottom-fishing at the open the day after a limit-down returns −1.39% per trade (t = −21, round 97). The losses are concentrated overnight: the T+1 rule (shares bought today cannot be sold until the next trading day) keeps retail investors from capturing the daytime rebound, consistent with the attention-driven buying in Barber and Odean (2008).
4.4 A-share company announcements
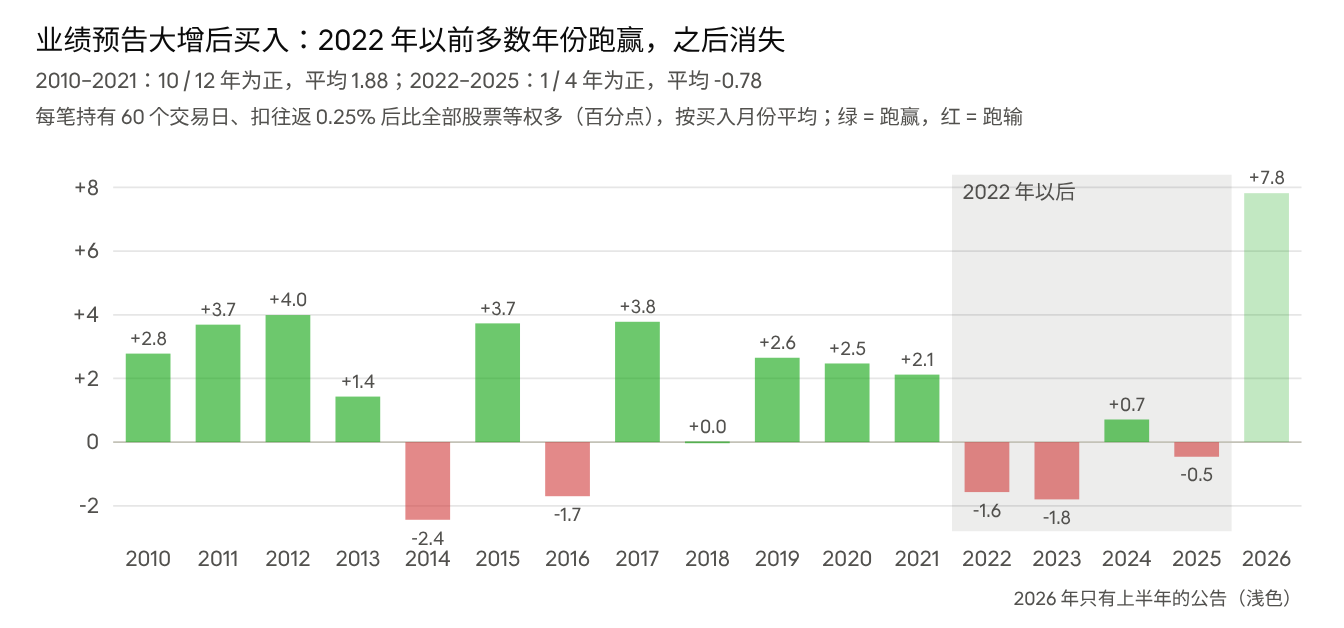
Round 98 · East Money earnings pre-announcements (expected increase + return to profit), announcement dates 2010-01 → 2026-06, 31,000 buyable events
Chart text (translated): Buying after large positive earnings pre-announcements: outperformed in most years before 2022, then disappeared. 2010–2021: positive in 10 / 12 years, average 1.88; 2022–2025: positive in 1 / 4 years, average −0.78. Each trade held 60 trading days; excess over all stocks equal-weighted after a 0.25% round-trip cost (percentage points), averaged by month of purchase; green = outperform, red = underperform. Axis: year 2010–2026; −2 to +8. Series/labels: 2010 +2.8; 2011 +3.7; 2012 +4.0; 2013 +1.4; 2014 −2.4; 2015 +3.7; 2016 −1.7; 2017 +3.8; 2018 +0.0; 2019 +2.6; 2020 +2.5; 2021 +2.1; 2022 −1.6; 2023 −1.8; 2024 +0.7; 2025 −0.5; 2026 +7.8; shaded area “2022 onward”; note: “2026 has first-half announcements only (light color)”.
Buying at the open on the first trading day after an “expected increase / return to profit” earnings pre-announcement and holding for 60 trading days beats the whole market by 1.50% per trade after costs (t = 2.82), a pass under the pre-registration; but the monthly average for 2022–2025 is −1.05, and only 40–47% of individual trades outperformed, so it is not adopted (round 98). The timing matches the expansion of quantitative private funds after 2021 (see Section 5). East Money’s pre-announcement table excludes delisted companies; switching to “stocks that survived to today” as the benchmark changes the result by only 0.1 percentage points.
A large drop in the number of shareholders (“chip concentration,” 筹码集中) gives +0.17% (t = 0.37) and purchases by major shareholders give −0.16% (t = −0.47), neither significant; the reverse, however, is significant: stocks whose shareholder count rose by more than 20% in one quarter underperformed by 1.23% over the next 60 days (t = −2.4, round 99)—again the side where retail investors pour in.
5 Chinese mutual-fund enhanced index funds
Mutual-fund enhanced index funds are one of the few channels in this study through which small investors can earn A-share excess returns, but only the excess of CSI 1000 enhanced funds remains significant after removing IPO income and style effects; the “excess” of CSI 300 (沪深 300) and CSI 500 (中证 500) enhanced funds came mainly from the IPO-subscription bonus that comes with mutual-fund status, and it has decayed since 2021.
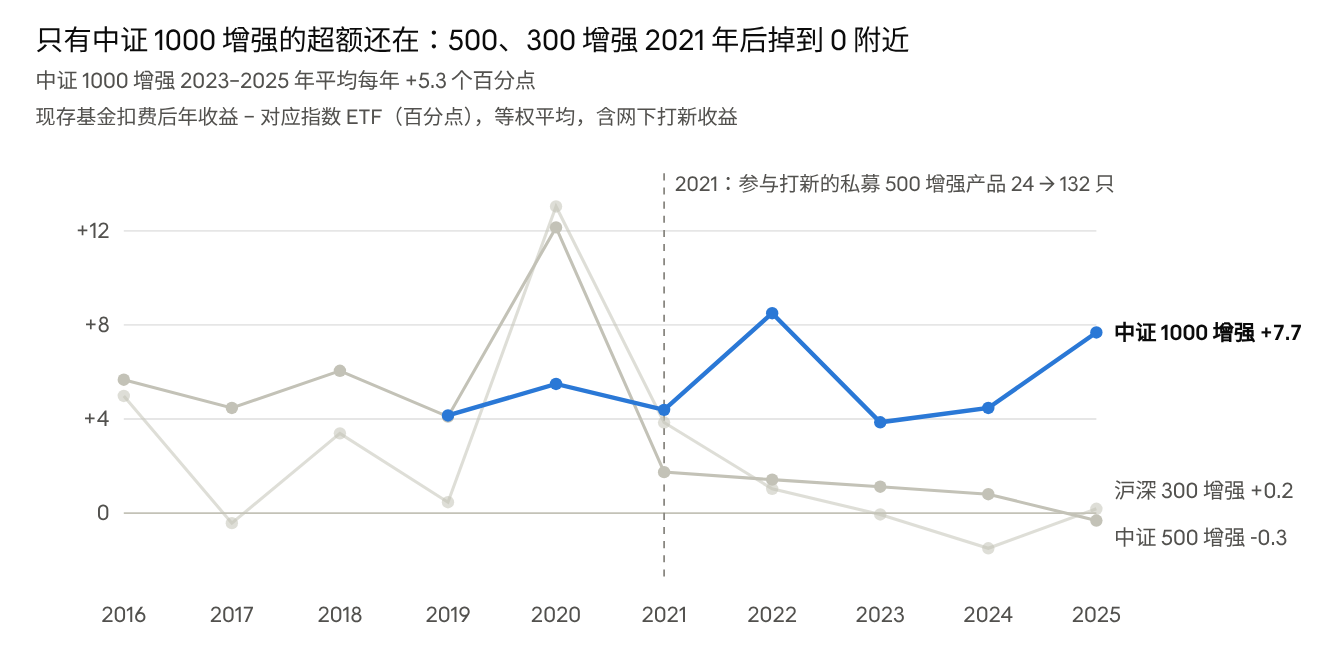
Round 21 · Tiantian Fund adjusted NAVs, 207 surviving enhanced index funds (a category is plotted for a year only if it has ≥ 5 funds), compared with 510300 / 510500 / 512100
Chart text (translated): Only CSI 1000 enhanced funds still have excess returns: CSI 500 and 300 enhanced funds fell to near 0 after 2021. CSI 1000 enhanced averaged +5.3 percentage points a year in 2023–2025. Surviving funds’ after-fee annual return − corresponding index ETF (percentage points), equal-weighted, including offline IPO income. Axis: year 2016–2025; 0 to +12. Series/labels: dashed line at 2021: “2021: private 500-enhanced products participating in IPO subscriptions 24 → 132”; end labels “CSI 1000 enhanced +7.7” (blue), “CSI 300 enhanced +0.2”, “CSI 500 enhanced −0.3”.
5.1 Excess returns after fees
Comparing 207 CSI 300, CSI 500 and CSI 1000 enhanced funds with the corresponding index ETFs (round 21): CSI 1000 enhanced funds earned +3.9, +4.5 and +7.7 percentage points a year in 2023–2025, with 80–89% of funds outperforming. Annual excess returns within each category do not persist (autocorrelation −0.24 to +0.18), so picking funds by last year’s performance has no basis; buying 5 at random, even the worst 5% of outcomes beat the ETF by 1.4–3.3 percentage points a year (round 47). Lower-fee funds have higher excess returns (cross-sectional slope t = −3.1, round 57).
5.2 Offline IPO allocation
Mutual funds get priority in offline allocations of new shares. After estimating and removing IPO income using about 100,000 fund-by-fund allocation records from East Money (round 53):
| Category | Annualized α (incl. IPO income) | After removing IPO income | Also removing smaller-cap, size, turnover, low beta |
|---|---|---|---|
| CSI 300 enhanced | 2.8% | 0.35% (t = 0.48) | — |
| CSI 500 enhanced | — | 1.7% (t = 1.6) | — |
| CSI 1000 enhanced | 6.2% (t = 5.4) | 4.1% (t = 3.4) | 3.2% (t = 2.7) |
After removing IPO income, CSI 1000 enhanced funds still earned +3.1, +3.8 and +6.8 a year in 2023–2025. The style controls use “smaller cap” (CNI 2000 (国证 2000) − CSI 1000) and self-built Liu–Stambaugh–Yuan size and abnormal-turnover factors (correlations with the public versions 0.97 / 0.93); the smaller-cap coefficient is −0.13 (t = −1.25), so the excess does not come from quietly holding micro-caps (rounds 45, 58).
5.3 Decay and crowding
Mutual-fund AUM (round 44), the correlation of excess returns across funds (46), total market turnover (48), the cross-sectional dispersion of stock returns (56) and fund flows (60) all fail to explain the decay of CSI 500 enhanced funds. Private fund AUM is not public, but private products also take part in offline IPO subscriptions: counting entries on the allocation-account lists, the number of private 500-enhanced products participating in IPO subscriptions grew from 3 at the end of 2019 to 132 at the end of 2021 and about 190 in 2022, matching the timing of the collapse in excess returns, but the regression t = −1.62 is not significant (round 62).
This yields a prediction that can be tested going forward: private 1000-enhanced products grew from 83 to 173 over 2025Q3 → 2026Q3 (from 0.90% → 1.36% of all allocation accounts, already above the 0.86% for 500-enhanced products at the end of 2021), while the 1000-enhanced category’s excess return for January–September 2026 is still +3.1%. If the crowding explanation holds, 1000-enhanced excess returns should fall markedly over the next year or two.
5.4 Other tests
- Index reconstitution (rounds 49–52): in the June and December reconstitution months, monthly excess returns are higher by 0.45 (500 enhanced, t = 2.24) and 0.68 (1000 enhanced, t = 2.42) percentage points; deleted stocks underperform by 2.5% before the change takes effect (t = −3.3), but this cannot be linked event by event to reconstitution-period excess, and full holdings show no underweighting either (round 65).
- Survivorship bias (round 59): a mutual fund’s allocation-account code is its fund code, so liquidated funds can be recovered; 0 1000-enhanced funds were liquidated, and adding back the liquidated 500 / 300 funds changes the annual average by < 0.6 percentage points.
- Exit rule (round 102): “switch back to the ETF if the category’s excess over the past 12 months is negative” loses money in all three categories (−1.58 / −0.60 / −0.44 a year)—500-enhanced excess went from high to low without turning negative, so the rule exits too late. Instead, monitor the number of private products and the category excess each year, and consider switching only when both conditions are met.
- Exchange-traded vs over-the-counter (round 106): 6 exchange-traded enhanced ETFs have fees about 0.45 percentage points lower and average excess returns 1.0–1.5 higher in 2024–2025, with almost the same median; most are very small.
- Small-cap stampede and sharp rally (round 110): from 2023-12-29 → 2024-02-05 the CSI 1000 fell 27.1%, while the 13 1000-enhanced funds already operating at the start of 2023 had average excess returns of +2.48% (12 positive); cross-sectionally this is unrelated to the “smaller-cap” exposure from 2023 daily regressions (t −0.55); one reason is that mutual funds’ beta is about 0.9. The cost comes in sharp rallies: in the two weeks of the 9·24 rally (September 24), the index rose 38.7%, while 1000-enhanced excess was −2.93% and 500-enhanced −4.28%, with every fund negative. The deepest drawdown of category cumulative excess was −6.2%, recovered in about 7 months.
- Same company across products (round 112): within the same year, a company’s 500 / 300 enhanced and 1000 enhanced excess returns have rank correlations of 0.41–0.61; splitting into halves by the historical excess of a company’s other enhanced products, the top half’s 1000-enhanced funds are 1.9 percentage points higher the next year, but t = 1.87, which fails under the pre-registration.
- Fund manager changes (round 111): among 397 manager changes in the 207 enhanced index funds, there were 27 complete replacements with a full 12 months before and after: in the following year they returned −1.50 percentage points relative to peers (t = −1.52), but they were already at −2.99 in the year before the change; after 230 partial changes, the following year was −0.12. Quantitative enhanced funds’ excess returns do not appear to be tied to individual managers, but the complete-replacement sample is small.
- Benchmarks: mutual-fund quantitative hedge funds (公募量化对冲基金), with market exposure hedged out, have returned 2.4% annualized since 2015, vs 2.3% for Yu’e Bao (round 66); fully hedging with CSI 500 futures cost an average of about 9.8% a year in futures discount over 2016–2025 (round 74)—enhanced funds’ excess returns can be earned only by bearing full market risk.
6 Other assets and strategies
Among arbitrage, cryptocurrencies, options, commodities, high-frequency trading and the timing methods commonly used by retail investors, only BTC cash-and-carry arbitrage passed under the pre-registered criteria, and its return over the last 12 months has been about the same as short-term Treasuries.
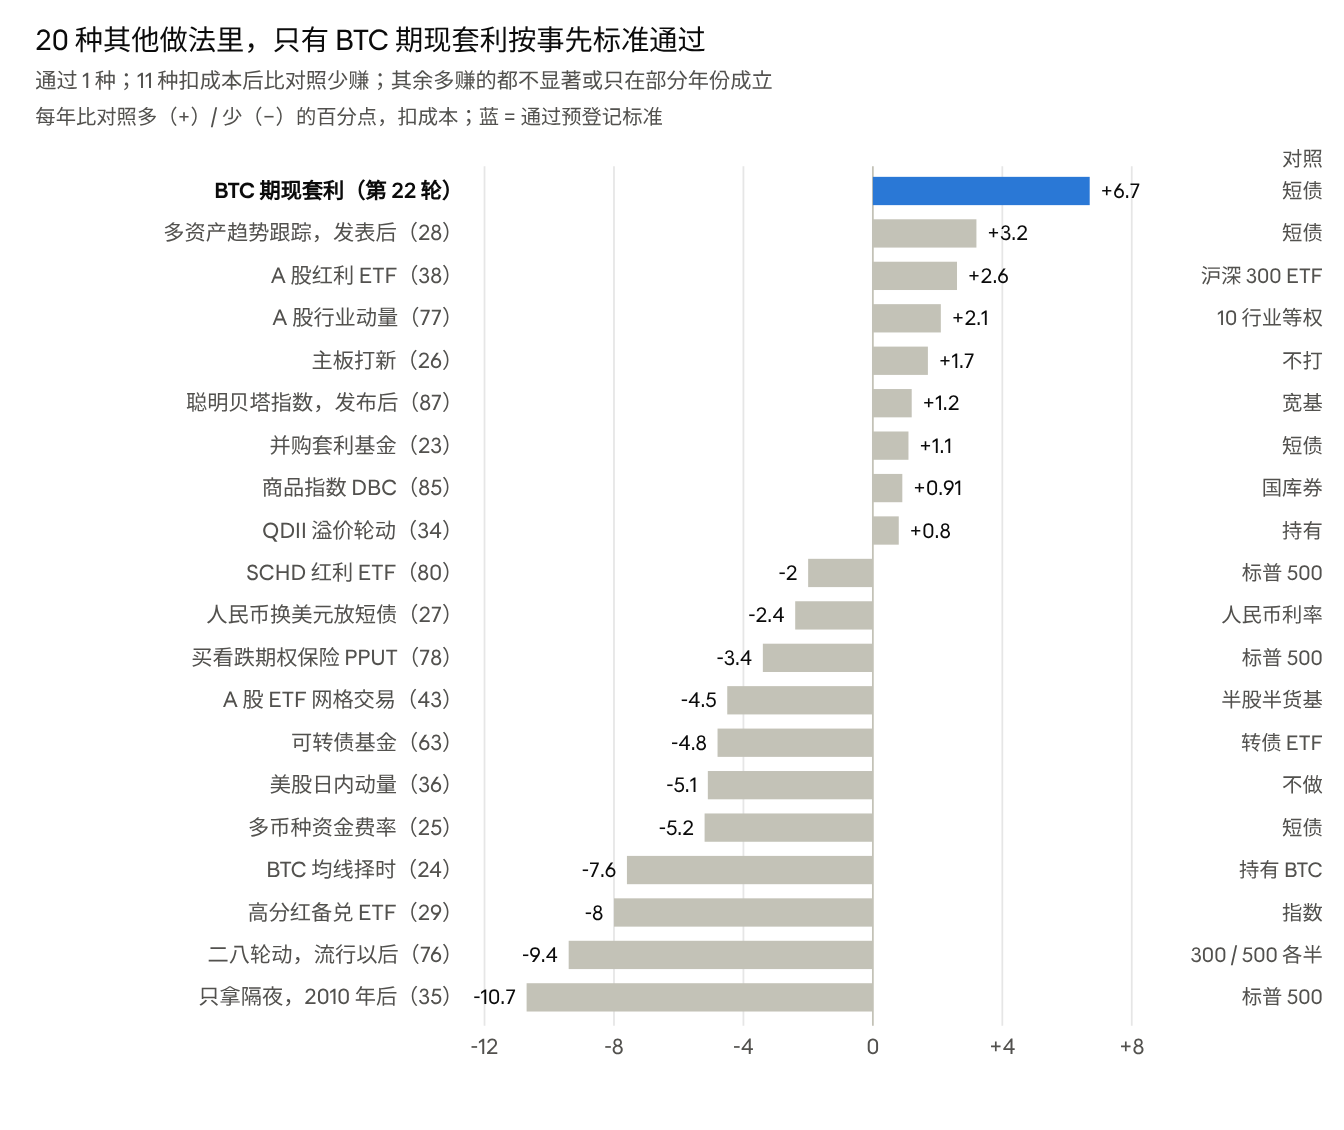
Annualized differences reported in each round (numbers copied from ROUNDS in `research/profit_overview.py`) · limit-up chasing and limit-down bottom-fishing are measured per trade, and BTC intraday momentum (about −37 a year) is not shown
Chart text (translated): Of 20 other approaches, only BTC cash-and-carry arbitrage passed the prior criteria. 1 passed; 11 earned less than their benchmark after costs; the rest that earned more were not significant or held only in some years. Percentage points a year above (+) / below (−) the benchmark, after costs; blue = passed the pre-registered criteria. Axis: −12 to +8. Series/labels (approach (round): value; right column “Benchmark”): BTC cash-and-carry arbitrage (round 22): +6.7, short-term bonds; Multi-asset trend following, after publication (28): +3.2, short-term bonds; A-share dividend ETF (38): +2.6, CSI 300 ETF; A-share industry momentum (77): +2.1, 10 industries equal-weighted; Main-board IPO subscription (26): +1.7, not subscribing; Smart-beta indexes, after launch (87): +1.2, broad-based index; Merger-arbitrage funds (23): +1.1, short-term bonds; Commodity index DBC (85): +0.91, Treasury bills; QDII premium rotation (34): +0.8, holding; SCHD dividend ETF (80): −2, S&P 500; RMB converted to USD in short-term bonds (27): −2.4, RMB interest rate; Put-option insurance PPUT (78): −3.4, S&P 500; A-share ETF grid trading (43): −4.5, half stocks / half money market fund; Convertible bond funds (63): −4.8, convertible bond ETF; US intraday momentum (36): −5.1, not trading; Multi-coin funding rate (25): −5.2, short-term bonds; BTC moving-average timing (24): −7.6, holding BTC; High-dividend covered-call ETFs (29): −8, index; Large/small-cap rotation, after it became popular (76): −9.4, half 300 / half 500; Overnight only, after 2010 (35): −10.7, S&P 500.
- Cryptocurrencies (rounds 22–25, 33, 37, 96): buying BTC while shorting an equal amount of perpetual contracts, collecting only the funding rate, returned 9.8% annualized in 2020–2026, with a maximum drawdown of about −1%, vs 3.1% for short-term bonds over the same period; the returns were concentrated in bull markets, and exchange-failure and legal risks do not show up in a backtest. Rotating weekly into the 5 coins with the highest funding rates, switching costs ate up the extra funding. Newly listed coins have a median 90-day excess return relative to BTC of −43.5%; the one-year mean is +239%, almost entirely due to a single coin, AXS—a lottery-like distribution.
- Arbitrage and trend following (rounds 23, 28): merger arbitrage is like selling put options: small gains in normal times, losses in crises (Mitchell and Pulvino 2001). The after-fee Sharpe ratio of AQR’s time-series momentum fell from 1.2 before publication to 0.24 after, but in months when US stocks fell more than 5% it earned 2.4% on average, making it more like crisis insurance.
- Options and commodities (rounds 29, 78, 85): protective puts (PPUT) cost about 3.4 percentage points a year in premiums, and their maximum drawdown of −42% is still deeper than the moving-average rule’s −37%; puts protect against “fast drops” (only a 12% fall in March 2020), while the moving-average rule protects against “slow drops.” The commodity index’s deepest fall was 76%; holding part of the portfolio in it is worse than holding Treasuries.
- High frequency (rounds 35–37): the S&P 500 overnight effect was strong in 1993–2009 and essentially disappeared after 2010; intraday momentum, with the first half hour predicting the last half hour, has t = 0.58 after 2014. The predictable part is only a few basis points, while a small account’s round-trip cost is 3–10 basis points.
- Selection bias in index backtests (rounds 87, 88, 90): 420 CSI thematic, strategy and style indexes (launched 2010–2021) beat the CSI All Share (中证全指) by 4.3 percentage points a year in pre-launch backfilled data, and trailed it by 0.8 after launch; this holds in all 12 launch years, and the gap is still 3.3 after controlling for size and value styles. It is the same mechanism as the decay of anomalies after publication: only indexes with good-looking backtests get launched.
- Active funds and investor timing (rounds 81, 86, 91, 92): active equity funds in 2016–2025, after adding back 250 liquidated funds, still beat broad-based indexes by about 4.5 percentage points a year, but almost all of it came from 2019–2020, and chasing last year’s winners did not help. A-share ETF investors did not earn less because of the timing of their entries and exits; investors in over-the-counter enhanced index funds earned 2–4 percentage points less under most measures, but this is sensitive to the end date.
7 Investor-level questions
For a Chinese individual investor who holds forever and files as required, the biggest influences on final wealth are not market timing or stock picking but three allocation choices: whether to sell (tax), which vehicle to hold through (tax and estate tax), and whether to bet on one country or diversify globally.
7.1 Tax and holding vehicles
For Chinese tax residents, the common online claim that “Irish accumulating ETFs are more tax-efficient” holds only if you never sell: the China–US tax treaty reduces US withholding on dividends to 10%, whereas Irish funds are withheld 15% at the fund level, which cannot be credited. CSPX − VOO (2010-09 → 2026-10, annualized percentage points, rounds 68, 100):
| Basis | CSPX − VOO |
|---|---|
| Pre-tax | −0.32 |
| Filing as required, sell at the end | −0.05 |
| Not filing | −0.12 |
| Filing as required, never sell | +0.09 (higher in 85% of ten-year windows) |
Once US assets exceed $60,000, a non-US person who dies owes US estate tax at marginal rates of 26–40%: on $300,000, about $75,000, which over 40 years of holding is equivalent to 0.7 percentage points less a year; Ireland-domiciled ETFs do not count as US assets. Domestic S&P 500 QDII funds are tax-free for individuals, but in recent years their tracking difference has been 1.6–5 percentage points a year worse (round 55).
7.2 Single-country risk
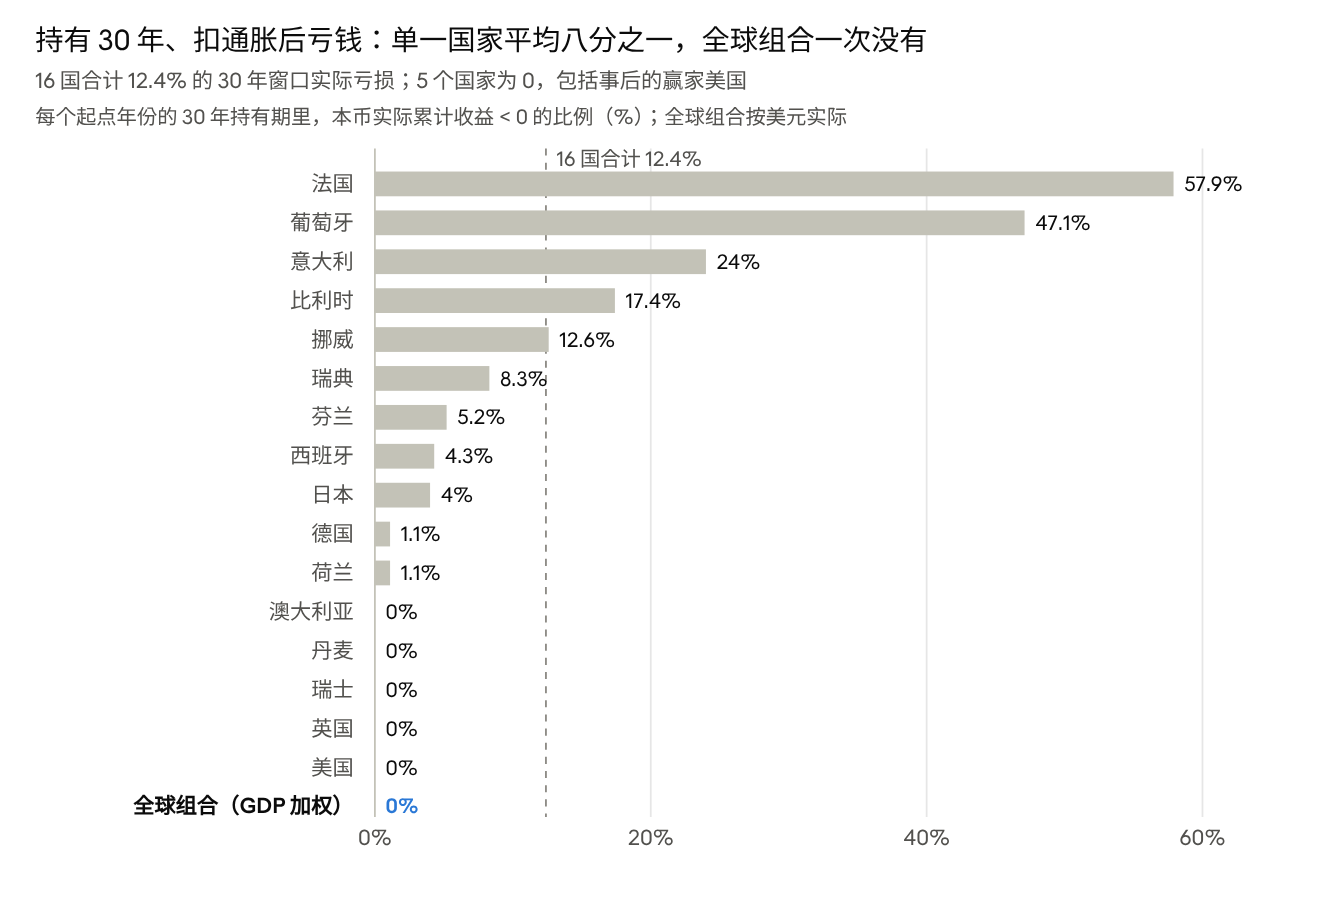
Round 101 · JST Macrohistory Database R6, annual data for 16 countries 1870–2020, start years 1870–1991; Germany 1922–1924 and windows with missing data excluded
Chart text (translated): Losing money after inflation over a 30-year hold: one in eight on average for a single country, never for the global portfolio. Across the 16 countries, 12.4% of 30-year windows had real losses; 5 countries had 0, including the US, the winner in hindsight. Share of 30-year holding periods, by start year, with cumulative real local-currency return < 0 (%); global portfolio in real US dollars. Axis: 0% to 60%. Series/labels: dashed line “16 countries combined 12.4%”; France 57.9%; Portugal 47.1%; Italy 24%; Belgium 17.4%; Norway 12.6%; Sweden 8.3%; Finland 5.2%; Spain 4.3%; Japan 4%; Germany 1.1%; Netherlands 1.1%; Australia 0%; Denmark 0%; Switzerland 0%; UK 0%; US 0%; Global portfolio (GDP-weighted) 0% (in blue).
A single country trailed the global portfolio by more than 2 percentage points a year in 38% of 30-year windows; on average the global portfolio actually earned about 1.4 percentage points a year more than a single country, so diversification has no cost. The US ranked a median 3rd among the countries with data at the time, but it still trailed the global portfolio in 36% of 30-year windows. Measured by year-end values, the longest the global portfolio took to get back to its starting point was 11 years (1974–1984), the US 13 years (2000–2012), and Japan 31 years (1990–2020). JST includes only countries that are still rich today, with no examples of stock markets going to zero like Russia in 1917 or China in 1949, so single-country risk is underestimated.
7.3 Stock-bond and cross-currency allocation
- Government bonds within A-shares (rounds 69, 70, 75, 89): about 3/4 CSI 1000 + 1/4 government bonds has had a maximum drawdown of −59% vs −72% since 2006, with an annualized return only 0.19 lower; using real 1000-enhanced funds and a government bond ETF (from 2019), drawdown is −27% vs −36%, with an annualized return 2.8 lower. Rotating between stocks and bonds by moving average adds only 0.45 over a fixed ratio.
- How often to rebalance (round 109): for 3/4 + 1/4, rebalancing once at the end of each year is enough: 2005–2026 annualized 13.1% / drawdown −53%, about the same as “check monthly and rebalance when off by more than 10 percentage points”; rebalancing every month actually loses about 1 percentage point a year; never rebalancing lets stocks drift to over 90%, losing about 10 percentage points more in a crash like 2015.
- Which bond duration (round 115): for 3/4 CSI 1000 + 1/4 government bonds, 5-year and 10-year bonds are almost the same: annualized 14.22% vs 14.21% in 2009–2017, 1.51% vs 1.78% since 2018, and the same full-period drawdown of −53.9%. Under the rules, stay with 5-year bonds. In months when the CSI 1000 fell more than 10%, 30-year bonds gained +1.6% on average, but they can lose 5–10% in a single year.
- Is Yu’e Bao good enough for the defensive part (round 116): 2013-06 → 2026-09, 3/4 CSI 1000 + 1/4 Yu’e Bao returned 4.48% annualized, vs 4.65% with 1/4 government bonds (after fees), with maximum drawdowns of −54.1% vs −54.0%; under the rules, “Yu’e Bao is fine.” In months when the CSI 1000 fell more than 10%, government bonds gained only +0.39% on average: losing less comes mainly from holding only 3/4 in stocks, not from bonds’ hedging.
- Switching the defensive part to an S&P QDII (round 103): over the full 2006–2026 period, annualized return is 1.57 lower and drawdown 6.3 deeper, so under the rules government bonds are kept; but since 2015, and with real funds since 2019, the QDII did better—the conclusion depends on RMB appreciation and the big A-share bull market in 2006–2014.
- The split between RMB and USD (round 107): in a global crisis like 2008, any mix falls by about half; since 2015, all in 1000-enhanced funds had a deepest drawdown of −65%, half and half −35%, and all in global stocks −20%, while annualized returns rose in the same order (6.7%, 9.6%, 11.9%).
7.4 How to invest new money
- Lump-sum investing beat spreading purchases over 12 months about 70% of the time in US stocks; in A-shares it is roughly a coin toss (round 71).
- Holding cash and “waiting for a 20% drop to buy” did better in only 43% of 20-year windows in the US since 1926 (12% after 1990), with ending wealth about 3% lower on average; Japan’s long bear market after 1990 is the exception (round 104).
- Alipay-style “smart regular investing,” in a fair comparison with the same total amount invested, adds only 0.4% over 10 years on the CSI 1000; the high returns that platforms display come mainly from investing more principal at low points (round 105). Target-profit regular investing (taking profit at 20%) is no better than plain regular investing either (round 79).
- The exception for small amounts of new money is the fixed minimum commission per trade: when London-listed ETFs cost about $1.9 per trade and the broker pays no interest on the first $10,000 of cash, if monthly new money is less than about $300, save up for a few months before buying (optimal interval ≈ √(24 × fee per trade ÷ (expected return × monthly amount))); across 963 20-year windows in the US since 1926, at $100 a month, buying every 2 months beat buying every month 100% of the time, with a difference of about 0.5% of ending wealth.
7.5 Should a perpetual holder use leverage?
Borrowing to hold 1.5x stocks (borrowing rate = short-term bonds + 1.5%, rebalanced monthly), only the US, the winner in hindsight, reliably earned more: in 30-year windows since 1926, the median gain is 1.6 percentage points a year, and only 4% trailed 1x (round 108). With the JST global portfolio (1871–2020), leverage added only 0.4 a year, and one third of 30-year windows trailed; pooling single countries, more than half trailed. The cost is a bigger loss in crashes (US 1929–1932: 1.5x fell 95%, 1x 84%), and the gain is very sensitive to the borrowing spread: at a spread of 2.5%, the global portfolio no longer earns more. The evidence that “young people should use leverage” has the same problem as Section 7.2: it comes mainly from the US.
7.6 Should you add a small-cap value tilt?
No (round 114). In French’s developed-market data (including the US, 1990-07 → 2026-08), small-cap value, after deducting a fee difference of about 0.25 percentage points, beat the market by 1.96 percentage points a year (t 1.63), but −0.29 since 2008; the premium was almost entirely in the 2000s (+9.6). With a 30% tilt rebalanced annually, the full period gains 0.72 a year with almost the same drawdown, but its high point relative to the pure market portfolio came in April 2010, and 16 years later it is still 6.2% below it. Developed markets ex-US did better (+2.77, t 2.26), but that is not the main test.
8 Research credibility
The biggest risk in this research is self-deception: the researcher wants their own ideas to be right. Pre-registration, split-sample testing and prior probabilities are all meant to constrain this; post hoc checks show these constraints helped, but over-optimism remains.
8.1 Calibration of pre-registered forecasts
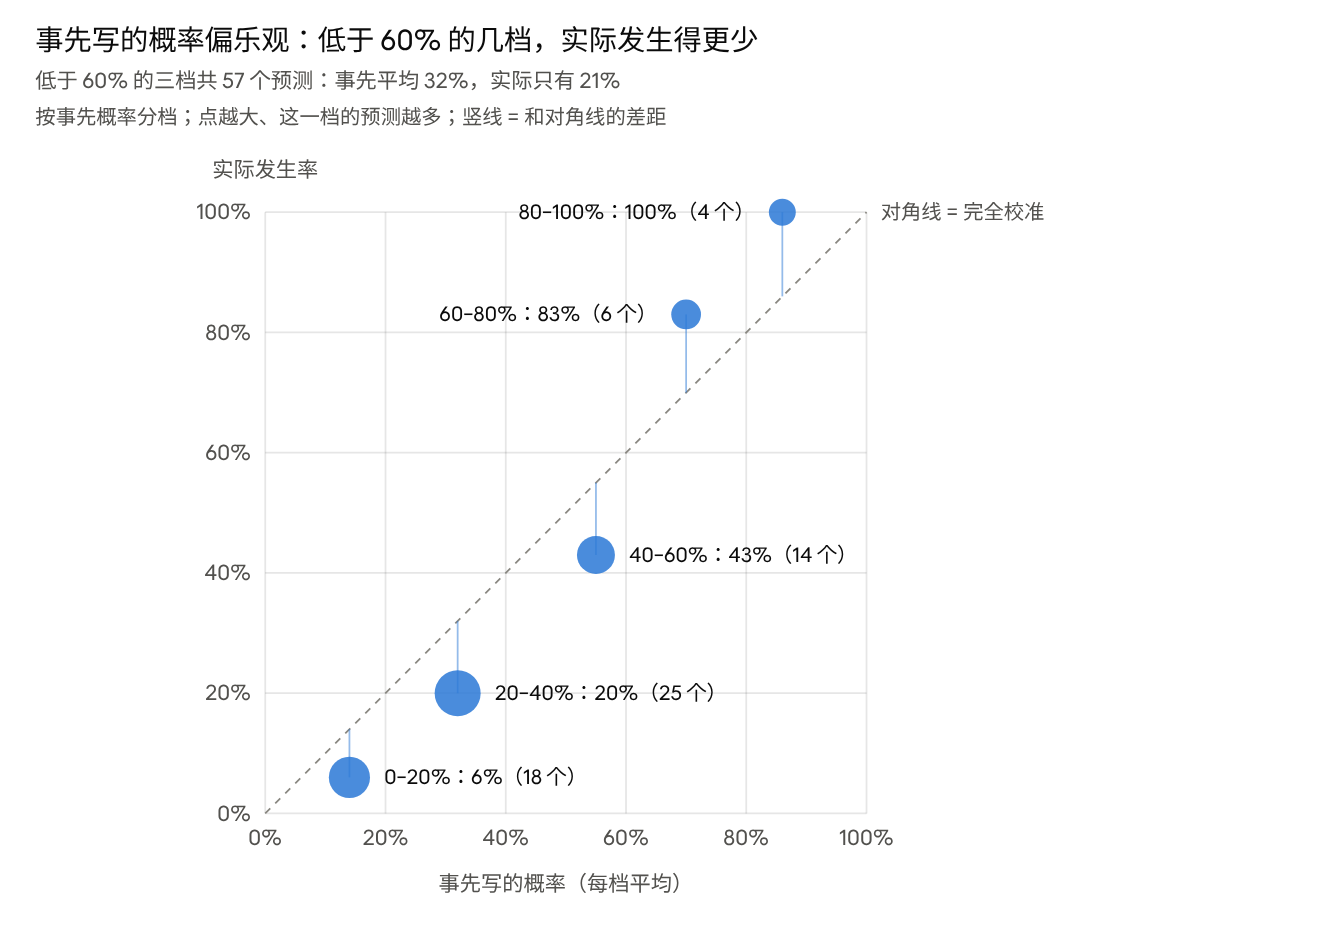
Hand-checked round by round from the research log · `research/calibration.py`, 67 forecasts in the 63 rounds among rounds 13–116 that recorded a probability
Chart text (translated): Prior probabilities were too optimistic: in the bins below 60%, outcomes occurred less often. The three bins below 60% hold 57 forecasts: prior average 32%, actual only 21%. Binned by prior probability; the larger the dot, the more forecasts in the bin; vertical line = distance from the diagonal. Axis: x = prior probability (bin average), 0% to 100%; y = actual occurrence rate, 0% to 100%. Series/labels: “80–100%: 100% (4)”; “60–80%: 83% (6)”; “40–60%: 43% (14)”; “20–40%: 20% (25)”; “0–20%: 6% (18)”; dashed line labeled “Diagonal = perfect calibration”.
The 67 forecasts had an average prior probability of 38%, and 31% actually occurred; the Brier score is 0.145, versus 0.215 for a baseline that always forecasts the average occurrence rate, a skill score of +0.32—the prior judgments carry information. The bias is concentrated in the “my idea will pass” type: 54 pass-type verdicts had an average prior of 34% and an actual rate of 26%; in the first half (rounds 13–57), prior 33% / actual 33%, and in the second half (from round 64), prior 42% / actual 30%—growing more optimistic over time. High-confidence conclusions (≥ 60%) were, if anything, conservative. Coding the outcomes involves some subjectivity; each item is listed in the report so it can be checked.
8.2 Multiple testing
Of the 54 “pass or fail” verdicts with prior probabilities, 14 passed. Most individual verdicts require t ≥ 2 plus the same sign in both sub-periods; if all hypotheses were false, a rough estimate is that about 1–2 would pass by chance. Credibility comes more from replication across markets and periods: the moving-average rule gave “annualized return no lower, drawdown shallower” in 9 markets (the Shanghai Composite had a shallower drawdown but slightly lower annualized return), while round 98’s pass no longer held after 2022.
8.3 Main limitations
- Backtests are not the future. The few edges that passed are all concentrated in a small number of years (long bear markets, A-share small-cap rallies).
- Short samples. Enhanced index funds are assessed mainly over 2019–2025, and funding-rate arbitrage over 2020–2026.
- Survivorship bias is only partly addressed. Only liquidated funds that took part in offline IPO subscriptions can be recovered; JST has no countries whose stock markets went to zero.
- The limits of free data. Complete fund holdings, private fund AUM and analyst consensus forecasts are unavailable, so related questions can be answered only indirectly.
- Topic selection itself has degrees of freedom. Pre-registration constrained each round’s verdict, but which rounds to run was the researcher’s choice.
- Tax treatment. Reporting and crediting of overseas income may be enforced differently in different places; conclusions are given on a “filing as required” basis.
8.4 Note on AI assistance
The research direction and constraints (only what an individual can actually execute, costs and taxes must be deducted, register before testing, report failures honestly) were set by me; data downloads, code, most of the test design and the analysis were done by the AI coding assistant Claude at my request, and I was responsible for reading, checking and final judgment. Each round’s pre-registration, data check, results and decision are recorded in the research log in time order, and every number can be recomputed from the raw data with the scripts in the project.
9 Conclusion
For a Chinese individual investor with very little capital who reports overseas income as required, only one source of excess return can be reliably captured from public data: CSI 1000 enhanced index funds, at about 3–5 percentage points a year after removing IPO income, and now facing the risk of crowding by quantitative private funds. BTC cash-and-carry arbitrage passed historically, but its excess return over the past year is close to 0; the US moving-average rule reliably reduces drawdowns, but for a filer who holds forever, its after-tax return is the same as buy and hold. The value of the remaining roughly 100 rounds lies in ruling things out: limit-up chasing, chasing new coins, waiting for pullbacks, smart regular investing, valuation timing, chasing hot indexes and last year’s champion funds, long-term leverage, and adding a small-cap value tilt are all no better than the simplest approach.
The result of the research is an allocation simpler than the one it started with. For the US dollar portion, hold an Ireland-domiciled accumulating all-world stock ETF forever: global because of single-country risk, accumulating because no sale means no taxable income, and Irish because it avoids US estate tax. For the renminbi portion, spread across 3–5 low-fee CSI 1000 enhanced funds, optionally putting about a quarter in government bonds or a money market fund to reduce drawdowns (the two differ by only about 0.2 a year, round 116). Invest new money in fixed amounts as soon as you have it, without timing. The same timing rule is still useful for people who will sell or who do not pay tax—what changes the answer is tax and horizon, not the rule itself.
The next steps are forward validation and filling data gaps.
- Forward validation: check the private 1000-enhanced crowding prediction every October; judge the A-share “most likely to fall” list once, per the pre-registration, when it reaches 12 months (around 2027-09); keep recording the moving-average rule’s monthly signals.
- More data: redo the crowding and announcement-signal tests with private fund AUM, full fund holdings and analyst consensus forecasts from Wind or CSMAR.
- Methodology: lower the probability of “will pass” by 5–10 percentage points at pre-registration, and keep adding each round’s result to the calibration table.
References
Compiled from memory; volume, issue and page numbers must be checked one by one before formal use.
- Anarkulova, A., Cederburg, S., & O’Doherty, M. S. (2022). Stocks for the long run? Evidence from a broad sample of developed markets. Journal of Financial Economics.
- Bailey, D. H., & López de Prado, M. (2014). The deflated Sharpe ratio: Correcting for selection bias, backtest overfitting, and non-normality. Journal of Portfolio Management.
- Barber, B. M., & Odean, T. (2000). Trading is hazardous to your wealth: The common stock investment performance of individual investors. Journal of Finance.
- Barber, B. M., & Odean, T. (2008). All that glitters: The effect of attention and news on the buying behavior of individual and institutional investors. Review of Financial Studies.
- Bernard, V. L., & Thomas, J. K. (1989). Post-earnings-announcement drift: Delayed price response or risk premium? Journal of Accounting Research.
- Carhart, M. M. (1997). On persistence in mutual fund performance. Journal of Finance.
- Chen, A. Y., & Zimmermann, T. (2022). Open source cross-sectional asset pricing. Critical Finance Review.
- Harvey, C. R., Liu, Y., & Zhu, H. (2016). … and the cross-section of expected returns. Review of Financial Studies.
- Hou, K., Xue, C., & Zhang, L. (2020). Replicating anomalies. Review of Financial Studies.
- Jordà, Ò., Knoll, K., Kuvshinov, D., Schularick, M., & Taylor, A. M. (2019). The rate of return on everything, 1870–2015. Quarterly Journal of Economics.
- Liu, J., Stambaugh, R. F., & Yuan, Y. (2019). Size and value in China. Journal of Financial Economics.
- McLean, R. D., & Pontiff, J. (2016). Does academic research destroy stock return predictability? Journal of Finance.
- Mitchell, M., & Pulvino, T. (2001). Characteristics of risk and return in risk arbitrage. Journal of Finance.
- Moskowitz, T. J., Ooi, Y. H., & Pedersen, L. H. (2012). Time series momentum. Journal of Financial Economics.
- Ritter, J. R. (1991). The long-run performance of initial public offerings. Journal of Finance.
- Treynor, J. L., & Mazuy, K. K. (1966). Can mutual funds outguess the market? Harvard Business Review.
Data: Ken French Data Library; JST Macrohistory Database (R6); Chen–Zimmermann Open Source Asset Pricing; SEC EDGAR XBRL; Tiantian Fund, East Money Data Center; China Securities Index Co., Ltd. website; China Financial Futures Exchange; baostock; Yahoo Finance; Binance (data.binance.vision); FRED.
Appendix: all 116 rounds at a glance
Each round’s pre-registration, data check, results and decision are recorded in the research log in time order; the table below gives the one-sentence version.
| Round | Question | Result |
|---|---|---|
| 1 | 18 price / volume factors in the S&P 500 | 0 significant after Holm correction |
| 2 | 9 classic factors in French all-market data, before vs after publication | 8 clearly weaker after publication; none with t > 2 after publication |
| 3 | Chen-Zimmermann’s 212 published anomalies | Under the original papers’ methods, 54% decay after publication (McLean-Pontiff: 58%); large caps only: negative on average after publication, 0 after correction |
| 4 | 4 accounting factors built from SEC point-in-time filings | Profitability (OperProf) passes (IC t = 2.59) |
| 5 | 14 factor ETFs after fees vs SPY | 0 reliably outperform |
| 6 | Long only: large-cap high profitability vs large caps | Post-publication t = 1.64, threshold 1.65, fail |
| 7 | Turn-of-the-month effect | 1926–1989 t = 7.7 → after 2010 t = 0.5 |
| 8 | Insider buying | +0.3%/yr (t 0.41) |
| 9 | RSI(2) “buy after a big drop” | Lost money in 1926–1989, made money after 1990: market structure changed |
| 10 | Large-cap high profitability outside the US | t = 0.42; round 6 not replicated |
| 11 | A-share size, abnormal turnover, reversal, momentum | Turnover and reversal t > 7, but returns concentrated on the short side |
| 12 | Trend rule applied to A-shares | Smaller drawdown, slightly lower return |
| 13 | Self-mined A-share factors: 53 daily features + ridge regression, most recent ten years held out and tested once | Ten-year out-of-sample IC 0.108 (t 10.3), but long-only top 10% after costs +4.3%/yr (t 1.72), threshold 2, fail |
| 14 | Trend rule applied to developed markets outside the US | Main test passes, all three regions pass; lags after 2009 |
| 15 | Rebalancing-date luck | All 21 check days meet the bar; return advantage 0 to 1.1 pp |
| 16 | Self-mined US S&P 500 factors (same process) | Exploration-period IC 0.00–0.02; the only “working” one was illiquidity created by survivorship bias, and after removing it all underperformed; never finalized, hold-out period untouched |
| 17 | Renminbi investor’s perspective | In RMB terms, v3 drawdown −42% vs SPY −59%; the exchange rate is normally a cushion, but amplified losses in 2008 |
| 18 | Idle cash in 10-year Treasuries vs short-term bonds | Better in all three periods, adopted; but worse in inflationary bear markets (1970s, 2022) |
| 19 | Versus a fixed stock-bond portfolio of equal volatility | Out of sample: fixed portfolio 10.8% / −52%, strategy 12.5% / −32%; 60/40 has the same drawdown but earns 3.6 pp less |
| 20 | Deflated Sharpe Ratio | In-sample DSR 0.01, out-of-sample PSR 0.75: excess return not statistically significant |
| 21 | A-share mutual-fund enhanced index funds after fees vs index ETFs (2023–2025) | CSI 1000 enhanced +3.9 / +4.5 / +7.7 pp a year, pass; 500 enhanced fell from +12% in 2020 to −0.3% in 2025 |
| 22 | Binance funding-rate arbitrage (long spot + short perpetual) | 2020–2026 annualized 9.8% vs short-term bonds 3.1%, drawdown −1%, pass; but level with short-term bonds over the last 12 months |
| 23 | Merger-arbitrage funds after fees vs short-term bonds | +2.0 since 1989, +0.6 to +1.7 over the last 10 years, fail |
| 24 | Trend rule applied to BTC (no leverage) | Drawdown only 16–19 pp smaller, Sharpe ratio almost unchanged, fail |
| 25 | Multi-coin funding-rate arbitrage (weekly rotation into the top 5 by funding rate) | Annualized −1.9%, drawdown −39%: gross return of about 15%/yr eaten up by switching costs, fail |
| 26 | A-share main-board IPO subscription (10,000 yuan of holdings each in Shanghai and Shenzhen) | About 1,150 yuan in 2020, about 330 yuan / yr in 2024–2025, fail |
| 27 | Converting RMB to USD and holding US short-term bonds (interest rate parity) | 2005–2026 annualized −2.4% (t −2.3), fail |
| 28 | Multi-asset time-series momentum (AQR, before vs after publication) | After-fee Sharpe ratio 1.19 → 0.24; +2.4%/month on average in stock-crash months, fail |
| 29 | High-dividend covered-call ETFs (JEPI, QYLD, etc.) vs index | Total return including dividends 5.5–10.6 pp a year lower, fail |
| 30 | Screener’s revenue and net-profit growth filter (SEC point-in-time annual reports) | Pass − fail −0.04%/month (t −0.42), no visible effect |
| 31 | Screener’s valuation score (P/E relative to its own history) | 1-month rank IC +0.003 (t 0.35), useless |
| 32 | A-share LOF premium arbitrage (subscribe on exchange, sell at T+2, assuming subscription is always possible) | +0.7% per trade, 51% of trades profitable; for QDII, using the NAV known at the time leaves only +1.2%, fail |
| 33 | BTC cash-and-carry: quarterly delivery contracts vs perpetuals | 7.8% vs 9.5%/yr, difference not significant (t −0.91) |
| 34 | A-share Nasdaq / S&P QDII ETF premium rotation (costs based on small capital) | Excess +0.8%/yr (t 0.7): relative premiums are very persistent and do not converge |
| 35 | US overnight effect (buy at the close, sell at the open) | Overnight minus intraday: 1993–2009 t 2.9 → after 2010 t 0.9; after costs far worse than holding |
| 36 | US intraday momentum (Gao et al. 2018) | After 2014 t 0.58; after costs −2 basis points a day |
| 37 | BTC intraday momentum | Negative coefficient (t −1.16); loses money even before costs |
| 38 | A-share dividend ETF vs CSI 300 ETF | Full-period annualized 8.0% vs 5.4%, but monthly excess t 0.61, year by year −30% to +23%: a style bet |
| 39 | A-share pre-holiday effect | CSI 300 2005–2014 t 2.8 → afterward t 0.9; CSI 1000 about 0 after costs |
| 40 | US industry momentum (French 12 industries + SPDR ETFs) | Before publication t 3.4 → after publication t 1.8; real ETFs only 0.9 pp more |
| 41 | A-share public REIT public subscriptions (small capital) | Popular ones can’t be allocated; the ones you can get are a matter of luck: −24 yuan in 2024, +1,009 yuan in 2025 (almost all from one) |
| 42 | Leveraging both stocks and bonds (50% SSO + 50% 10-year Treasuries) | Term premium exactly offset by the 2x ETF’s costs: out of sample 10.6% vs market 11.0%, −26.6% in 2022 |
| 43 | A-share ETF grid trading (brokers’ “grid conditional orders”) | Sells out after a few grid steps up, then stays in cash (73–99% of days); all four ETFs trail “half ETF, half money market fund” by 2.5–6.5 pp a year |
| 44 | Diseconomies of scale in enhanced index funds (Berk–Green, Pástor–Stambaugh–Taylor) | Not visible at the fund level (t −0.54); total mutual-fund AUM in the group can’t explain the 500-enhanced decay either |
| 45 | How much enhanced-fund excess comes from “smaller than the benchmark” exposure | 1000 enhanced α after removing small-cap exposure and low beta: 6.2% annualized (t 5.4); small-cap coefficient insignificant |
| 46 | Correlation of excess returns between funds as a crowding measure | 500-enhanced correlation rose in 2017–2021, but has no predictive power (t 0.40); all three groups peaked at the same time in 2024 |
| 47 | How many 1000-enhanced funds are enough to diversify | With 5, the worst 5% in 2023–2025 still +1.4–3.3 pp a year |
| 48 | Enhanced-fund excess and total market turnover | Unrelated (t 0.02): the 500-enhanced decay is structural |
| 49 | Is enhanced-fund excess concentrated in index reconstitution months | June and December +0.45–0.68 pp a month (t 2.2–2.6), no reversal the following month |
| 50 | CSI 500 reconstitution event study | Added stocks show no excess (t 0.8); deleted stocks underperform by 2.5% before the effective date (t −3.3) |
| 51 | CSI 300 reconstitution (replication) | Both added and deleted stocks underperform the index; does not hold under the pre-registration |
| 52 | The more deleted stocks underperform, the higher the reconstitution-period excess? | Not visible event by event (t 1.38, opposite direction) |
| 53 | How much enhanced-fund excess is offline IPO income (100,000 fund-level allocation records) | After removing IPO income, 1000 enhanced α 4.1% (t 3.4); 500 enhanced 1.7% (t 1.6), 300 enhanced 0.35% (t 0.5)—for these two groups, mutual-fund excess is mainly IPO income |
| 54 | Trend strategy under Chinese individual income tax | See Section 3.4: after-tax advantage +0.40 (v3.1) / −0.22 (short-term-bond version) |
| 55 | S&P 500: domestic QDII vs holding directly and paying tax | QDII median tracking difference −2.5%/yr; after-tax drag of direct holding −1.4%/yr |
| 56 | Can cross-sectional dispersion of stock returns predict enhanced-fund excess | No (t 0.31) |
| 57 | Enhanced-fund fees and net excess | Slope −2.4 (t −3.1, three groups pooled) |
| 58 | Self-built Liu–Stambaugh–Yuan size and turnover factors | After removing IPO income, size, turnover and low beta together, 1000 enhanced α still 3.2% (t 2.7) |
| 59 | Liquidated funds (recovered via offline allocation-account codes) | No 1000-enhanced fund was liquidated; 11 recovered for 500 / 300, impact within ±0.6 pp |
| 60 | Do inflows dilute next year’s excess | Money chases performance (t 2.9), but inflows don’t lower next year’s excess (t 1.2) |
| 61 | CNI / CSI 2000 enhanced vs 1000 enhanced | −2.2% in 2024, +11.3% in 2025; two years prove nothing |
| 62 | Number of private enhanced products in offline IPO subscriptions (crowding proxy) | Private 500 enhanced: 3 in 2019 → about 190 in 2022, matching the collapse in excess; pooled test t −1.6 |
| 63 | Convertible bond funds vs convertible bond index ETF | Trailed in each year of 2022–2024; equity beta, not excess |
| 64 | Sell-less v3.1 under Chinese individual income tax | After tax −0.10, but 2008 drawdown 8.3 pp deeper, fail |
| 65 | Do 1000-enhanced funds underweight deleted stocks before reconstitution (full holdings) | Underweight by only 0.25 pp (t −0.76); holdings don’t line up |
| 66 | Mutual-fund quantitative hedge funds (21) vs Yu’e Bao | 2.4% vs 2.3% annualized since 2015, lost in every year of 2023–2025, fail |
| 67 | Putting half of the US strategy’s defensive position in gold | Lost 20 pp less in 1973–74, but drawdown 1.8 deeper after 1990, fail |
| 68 | Chinese tax resident: VOO or Irish CSPX | VOO better whether filing or not (0.05 / 0.12 more a year) |
| 69 | A-share moving-average rotation between stocks and government bonds (CSI 500, from 2008) | Annualized 4.48% / drawdown −55% vs always holding 2.74% / −71%, pass |
| 70 | Fixed stock-bond portfolio with the same average position | 4.04% / −57%: timing adds only 0.45 more; a fixed ratio is simpler |
| 71 | Lump sum vs spreading over 12 months | US: lump sum wins 69%; CSI 500: 52%, close to a coin toss |
| 72 | Short- and medium-term bond funds (403) vs Yu’e Bao | 1.7 / 1.8 / 0.4 more a year; 2025 missed the threshold, fail |
| 73 | Half position when CAPE is above its historical median, before vs after publication | After publication, half position in 98% of months, annualized 6.26% vs 9.66%, fail |
| 74 | Can hedge fund returns be explained by “enhanced-fund excess − futures discount” | Full hedging with IC (CSI 500 futures) costs 9.8%/yr on average, but actual vs theoretical correlation is 0.16; the explanation is incomplete |
| 75 | Checking “3/4 1000 enhanced + 1/4 government bond ETF” with real funds | Drawdown −27% vs −36%, annualized 13.1% vs 15.8%: losing less costs money |
| 76 | Large/small-cap rotation | 3.7 more a year before it became popular; after, annualized −6.0% vs +3.4% for half and half |
| 77 | A-share industry momentum (strongest 3 level-1 industries) | 2.1 more a year, t 1.24, not adopted |
| 78 | Put-option insurance PPUT vs moving average | PPUT 7.6% / −42%, moving average 11.7% / −37% |
| 79 | Target-profit regular investing (20%) | Better in 54% of 5-year windows, 1.8% less on average, not adopted |
| 80 | SCHD vs S&P 500 (with Chinese individual income tax) | About 2 pp less a year, same drawdown |
| 81 | Active equity funds vs broad-based index; chasing last year’s winner | Overall 5.1 more a year, but concentrated in 2019–2020; chasing winners doesn’t help |
| 82 | Survivorship bias in active funds (recovered by name) | Method failed: the search interface can’t recover liquidated funds |
| 83 | Moving-average rule applied to India, Brazil, South Korea, Taiwan | 4/4 annualized no lower, drawdown smaller; all slightly behind after 2009 |
| 84 | A-share defensive 1/4: gold or government bonds | Gold drawdown 2.9 deeper and positively correlated with A-shares; keep government bonds |
| 85 | Commodity index ETF (DBC) | Only 0.9 more than cash over 20 years; deepest fall 76% |
| 86 | Redoing active-fund survivorship bias with allocation-account codes | 250 liquidated equity funds recovered; 5.1 → 4.5 more a year; round 81’s conclusion holds |
| 87 | A-share smart-beta indexes after launch vs broad-based index | 0 / 6 significant; pre-launch backfill 4.5 more a year, post-launch 1.2 |
| 88 | 420 CSI indexes, pre-launch backfill vs post-launch | 4.3 more a year before launch, 0.8 less after; holds in all 12 launch years |
| 89 | Full-history CSI 1000 check of 3/4 + 1/4 government bonds | Drawdown −59% vs −72%, almost the same annualized return |
| 90 | Do A-share thematic ETFs “peak at launch” | 5.0 more a year in the 12 months before inception, +1.0 after (t 0.6); not visible |
| 91 | Money-weighted returns of investors in 622 A-share ETFs | Investors didn’t earn less because of entry/exit timing; ETF flows lean contrarian |
| 92 | Money-weighted returns of investors in over-the-counter enhanced index funds | 2–4 pp less under most measures, but sensitive to the end date; not detectable under the rules |
| 93 | A-share recent IPOs for 3 years after first stopping at the daily limit vs mature stocks of the same market cap | 9.6 less a year (t −3.3), negative in 12 of 13 years |
| 94 | “A-shares most likely to fall” warning list (forward) | Archived and tracked monthly; judged once around 2027-09 |
| 95 | A-share limit-up chasing: buy at the open the day after a limit-up | −0.91% per trade after costs (t −27), negative in all 17 years; losses occur overnight |
| 96 | Newly listed Binance coins vs BTC | 90-day median excess −43.5%; one-year mean driven by a single coin, AXS |
| 97 | A-share limit-down bottom-fishing: buy at the open the day after a limit-down | −1.39% per trade after costs (t −21), negative in all 17 years |
| 98 | Buy after large positive / turnaround earnings pre-announcements, hold 60 trading days | Passes by the rules (+1.50%, t 2.8), but negative in 2022–2025, not adopted |
| 99 | Large drops in shareholder count; purchases by major shareholders | Neither makes money; after large increases in shareholder count, stocks underperform by 1.2 pp |
| 100 | Holding forever: US ETF or Irish accumulating ETF | Taxes and fees about the same (+0.09); once US assets exceed $60,000, estate tax outweighs other differences |
| 101 | Probability of a real loss holding a single country for 30 years (JST, 16 countries) | Single country 12.4%, global portfolio 0%; global earns about 1.4 more a year on average |
| 102 | Exit rule for enhanced index funds | Loses in all three categories (−0.4 to −1.6 a year); annual autocorrelation of category excess about 0 |
| 103 | RMB 1/4 defensive leg: government bonds or S&P QDII | Government bonds better over the full period; QDII better since 2015; depends on the period |
| 104 | New money: wait for a 20% drop vs buy when you have it | Buying when you have it is better; waiting loses about 3% on average; Japan is the exception |
| 105 | Smart regular investing vs plain regular investing | In a fair comparison, only 0.4% more over 10 years (CSI 1000) |
| 106 | Exchange-traded 1000-enhanced ETFs vs over-the-counter funds | Average excess 1.0–1.5 higher, median the same; weak evidence |
| 107 | The split between RMB and USD | No diversification benefit visible over the full period; since 2015, the higher the RMB share, the deeper the drawdown |
| 108 | Leverage for a perpetual holder | Don’t: the global portfolio at 1.5x earns only about 0.4 more a year, and about one third of 30-year windows trail no leverage |
| 109 | How often to rebalance RMB 3/4 + 1/4 | Once at the end of each year is enough; never rebalancing drifts to 90% stocks and loses about 10 pp more in 2015 |
| 110 | Enhanced-fund excess in the early-2024 small-cap stampede and the 9·24 rally | During the stampede, mutual-fund 1000 enhanced outperformed by about 2.5 (low beta); in the 9·24 rally, trailed by about 2.9 |
| 111 | Enhanced index fund manager changes | No visible effect: 12 months after a complete replacement, −1.5 vs peers (t −1.52), already about 3 behind before the change |
| 112 | Can a company’s other enhanced products predict its 1000-enhanced fund | Fail (t 1.87); the same company’s products rise and fall together (correlation 0.4–0.6) → spread across companies |
| 113 | Binance Launchpool (stake stablecoins to farm new coins) | Pre-registered; API rate-limited, data not obtained, no conclusion |
| 114 | All-world ETF plus a global small-cap value tilt | Fail: developed markets 1990–2026 +1.96 a year (t 1.63), −0.29 after 2008; a 30% tilt has lagged from 2010 to date |
| 115 | RMB 1/4 government bonds: 5-year or 10-year | Almost the same (full-period portfolio annualized difference 0.13); keep 5-year; 30-year can lose 5–10% in a year |
| 116 | RMB defensive 1/4: Yu’e Bao or government bonds | Yu’e Bao is fine: annualized only 0.18 lower, same drawdown; losing less comes from position size, not from government bonds |